In the article #1 & #2, we have managed to set up two agents on two different servers, configure a firewall, and encrypt traffic between one of the agents and the server. In today's article, we will mainly focus on the administrator panel, show what parameters are used to create server statistics, how to combine this data and draw graphs, as well as what problems are associated with monitoring the database in Zabbix.
Settings
In Zabbix, we divide the configuration into several tabs, each representing slightly different data and allowing for management of different areas. The most important ones are:
- Monitoring - Allows you to observe data that flows to the server from agents in real-time. Data can be viewed as single values for specific parameters or plotted on graphs.
- Services - Provides the ability to monitor specific services running on the network that are critical, such as DNS or SSH. From this tab, you can also generate an SLA report.
- Inventory - This is the central knowledge base of all hosts that allows for filtering, marking, and entering additional data such as organization or contact. Useful for managing a large number of devices.
- Reports - Allows for generating and scheduling periodic reports, audits, or managing notifications. However, to generate a report, you need to enable the report manager from the server settings.
- Configuration - Allows for editing settings, trigger editing, adding and deleting monitored hosts, or modifying graphs and entire templates.
- Administration - Provides the ability to manage accounts that have access to the Zabbix administrator panel, their permissions, create roles and user groups.
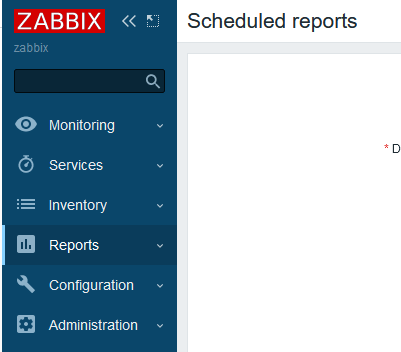
Picture 1. The most important tabs in the Zabbix panel
Data aggregation
The data that flows to the server depends on the selected template, which can be selected in the settings of a specific host in the Monitoring section. Zabbix has many default templates that are designed to ensure the retrieval of appropriate data, process it into graphs, and then display it on the dashboard. You can also create your own templates in the Configuration section, which can be based on these default templates provided by the Zabbix software.
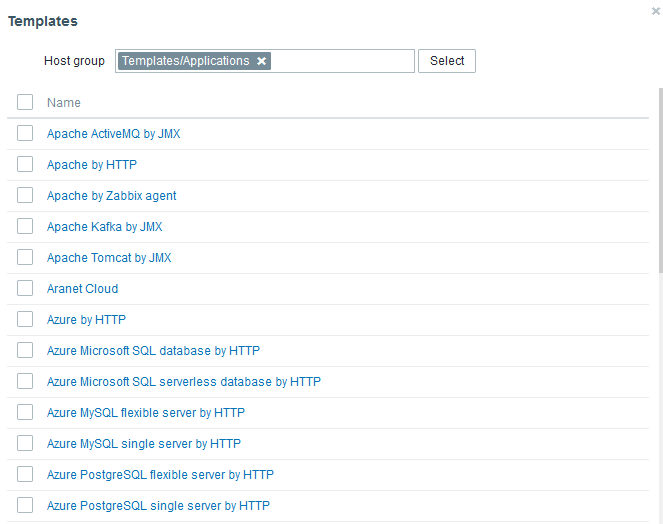
Picture 2. Templates available in Zabbix.
To verify if the installed agent is correctly fetching data from the host, go to Monitoring -> Hosts, and then click on the Latest Data section. If the latest data is from a few seconds ago, it means everything is working correctly.
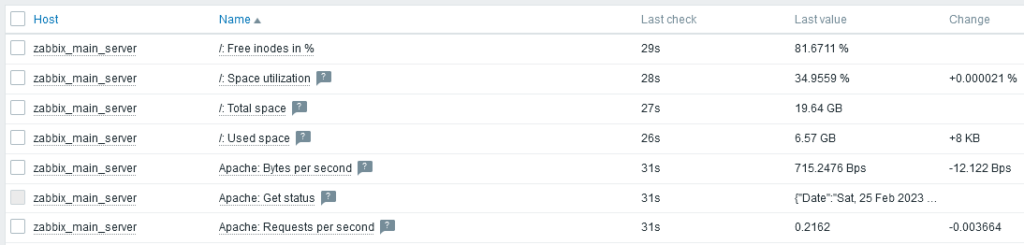
Picture 3. The "Latest Data" section of one of the server agents
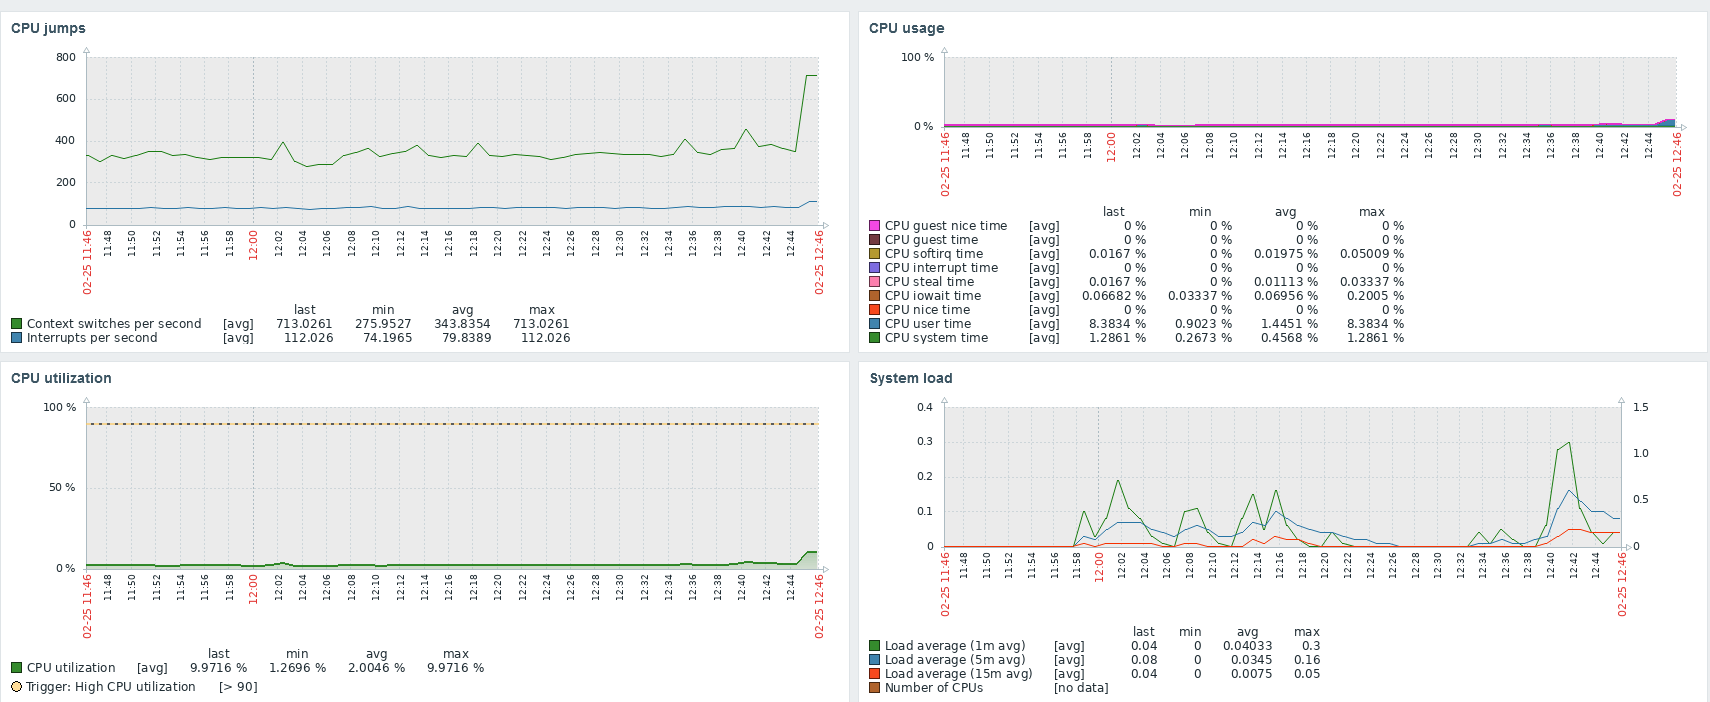
The visible data is then aggregated into graphs, which are in turn grouped into specific sections related to a particular component of the server (e.g. CPU).
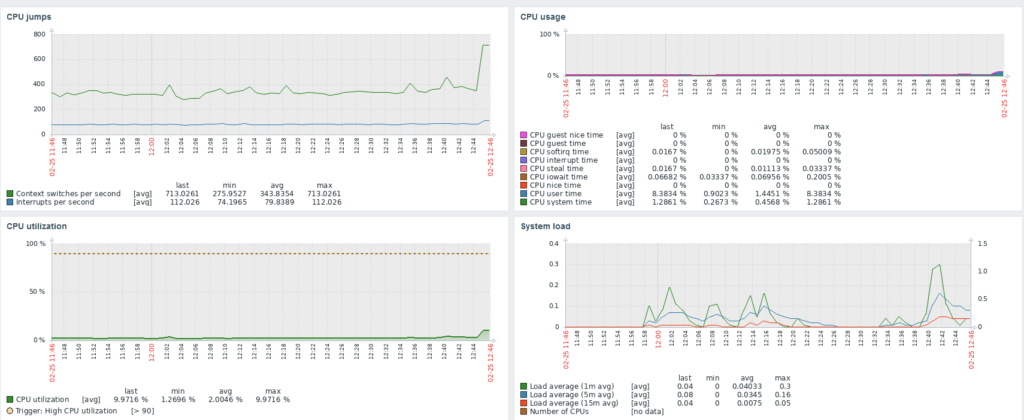
Picture 4. Charts from the CPU table generated based on the default Linux Server template
An important element of the template are triggers, which report problems to the administrative panel in case of specific changes on the server. Monitoring in this case includes aspects such as the server status, changes to the /etc/shadow file, or overload of disk or operational memory. The problem can be classified according to many levels of threat from "Information" to "Critical", which the administrator can modify depending on their needs
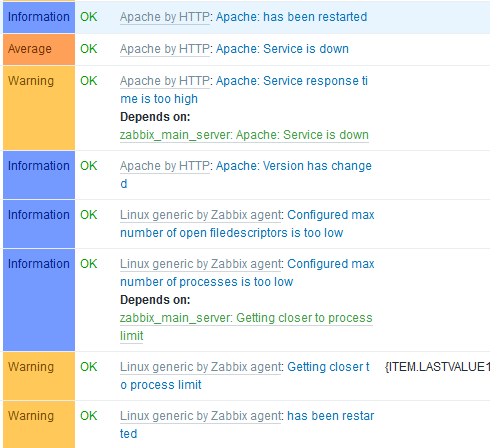
Picture 5. Examples of triggers present in the Linux Server and Apache templates
Troubles downloading the data - MySQL
Unfortunately, obtaining the appropriate data does not always come down to using the appropriate template. Sometimes additional intervention by the administrator is required, such as installing certain external packages on the monitored server, which will allow for obtaining the necessary data. This is the case, for example, with databases in Zabbix. In the case of MySQL MariaDB in the Debian system, a multi-stage process must be followed, which may be slightly different depending on the operating system or package versions being installed. At this point, it is worth making a backup of your work, for example by purchasing a snapshot service from the server administrator if it is offered. We begin by installing the necessary ODBC packages:
sudo apt-get install unixodbc unixodbc-dev
Next, you need to download the package with the library adapted to the system version from the database provider's website, in this case MariaDB, and execute subsequent commands.
wget https://downloads.mariadb.com/Connectors/odbc/connector-odbc-2.0.15/mariadb-connector-odbc-2.0.15-ga-debian-x86_64.tar.gz
tar -xvzf mariadb-connector-odbc-2.0.15-ga-debian-x86_64.tar.gz
cd mariadb-connector-odbc-2.0.15-ga-debian-x86_64
install lib/libmaodbc.so /usr/lib
Next, we edit the database and create a user for monitoring:
mysql
CREATE USER 'zabbix_monitor'@'%' IDENTIFIED BY ' zabbix_monitor_password';
GRANT PROCESS, SHOW DATABASES, BINLOG MONITOR, SHOW VIEW ON *.* TO 'zabbix_monitor'@'%';
Next, we create two files in /etc directory:
odbc.ini
[zabbix]
Driver=MariaDB
Database=zabbix
Server=127.0.0.1
UserName=zabbix_monitor
Password=zabbix_monitor_password
odbcinst.ini
[MariaDB]
Driver=/usr/lib/libmaodbc.so
Setup=/usr/lib/libmaodbc.so
After saving the files and executing this command, we should receive information upon logging in using isql.
isql -v zabbix zabbix_monitor
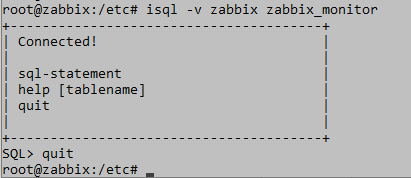
Photo 6. Correct execution of isql command
If we receive information about errors regarding the driver or library, we need to modify the configuration or download a different ODBC package. The last step is to add so-called "macros" in the administrator panel in the host, which are variables used in communication. Here we enter the name of the DSN (the first line of the odbc.ini file), the username, and the password.
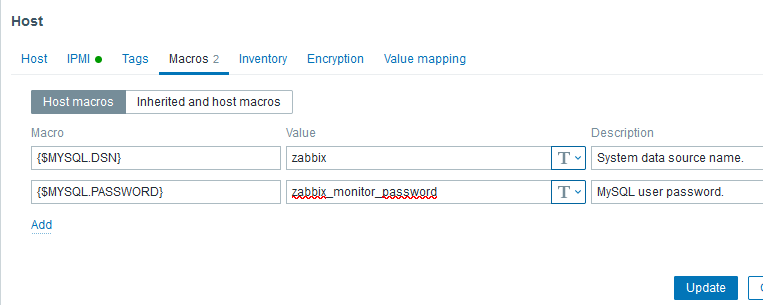
Picture 7. The data necessary to log in to MySQL and monitor it
Monitoring the MySQL database in this case is performed locally, meaning on the same server where the server is located. In the case of communication over the Internet, encryption must be configured between the agent and the host beforehand. The method mentioned above does not exhaust the topic, as it is only a single installation in a given version. Other versions of the database, as well as ODBC drivers, may significantly differ from each other and cause different problems. You can find descriptions of sample problems and solutions in the sources.
Notifications - email configuration
One of the most important elements of Zabbix are notifications about problems that the administrator is able to filter and send to the most popular platforms. We cannot expect the administrator to be in front of the monitor 24 hours a day, responding to the smallest incidents. However, we can expect that in the world of smartphones, they will be able to respond to serious incidents if they receive notifications via email or the messenger they use. The easiest way is to create a dedicated mailbox in Gmail, but notifications are also available via Jira, Slack, Discord, or Telegram. If we want to do this through Gmail, we need to create an account, confirm it using a phone, and generate a dedicated password for the application in the settings. Without this, it is not possible to log in to a Google account using the application. In the administrator panel, go to the Administration -> Media types tab and fill in the fields as shown in the image below.
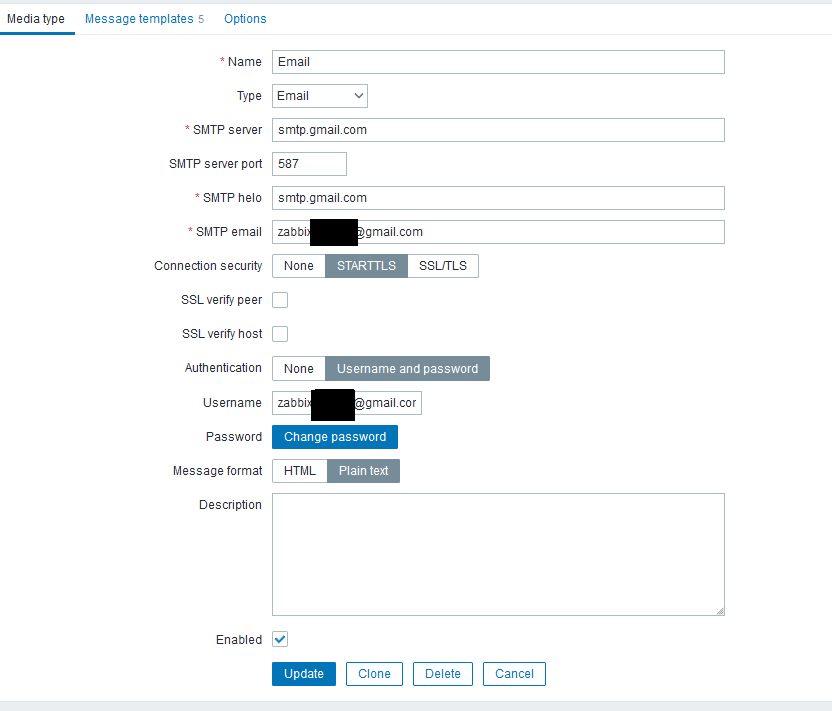
Picture 8. Media type e-mail configuration
After completing the configuration, you can perform a test from the Media Types tab. The last step is to connect the mailbox to the user's account in the Zabbix system. This can be done through the Administration -> Users tab.
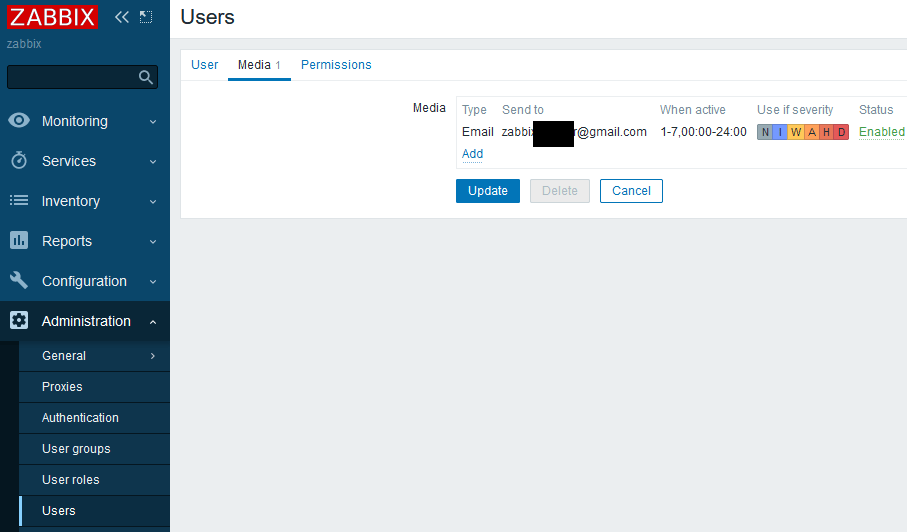
Picture 9. Connecting an email mailbox to notifications about problems
Summary
We hope that the information presented in the last episode of our Zabbix series will contribute to increasing the security of your servers. However, it should be mentioned that the knowledge presented here reflects only partially the range of possibilities of the Zabbix system. If the topic is interesting to you, we encourage you to browse the documentation and links from the sources section. Join us next week for an another article! Stay up to date and take care of your online security!
Sources:
https://stackoverflow.com/questions/34369436/im002unixodbcdriver-managerdata-source-name-not-found-and-no-default-driv
https://stackoverflow.com/questions/47179236/debian-9-odbc-mariadb-01000-cant-open-lib-file-not-found
https://www.linuxhelp.com/how-to-install-mariadb-odbc-connector-on-debian-11-3 https://www.ibm.com/docs/en/elm/6.0.6.1?topic=connection-configuring-odbc-driver-linux-aix-systems
https://stackoverflow.com/questions/47665813/unixodbcdriver-managerdata-source-name-not-found-and-no-default-driver-spe
https://stackoverflow.com/questions/16325607/cant-connect-to-local-mysql-server-through-socket-tmp-mysql-sock