In the previous article, we discussed various approaches used in machine learning for data processing. However, we still don't know in what form such data can be provided to the algorithm. After all, what we perceive with our senses as an image or sound is, from a computer's perspective, just a sequence of numbers! Today, as Innokrea, we will take a closer look at several commonly used methods of data representation, which are essential for choosing effective processing algorithms. Buckle up!
Data Representation Method 1: Images
In machine learning, images typically have the following properties:
- Height
- Width
- Number of channels.
Architectures designed for image processing usually require the image to be square. Various methods are used to align the dimensions, such as padding, scaling to a smaller size, or stretching.

Fig. 1: Reshaping the image dimensions
The height and width of an image are specified in pixels. The last parameter conventionally takes one of two values:
- 1 if it's a grayscale image
- 3 if it's a color image. In the case of color images, depending on the color format used (often RGB, red-green-blue), information about the color of a single pixel is expressed with three values. The first represents the red channel's intensity, the second the green, and the third the blue.
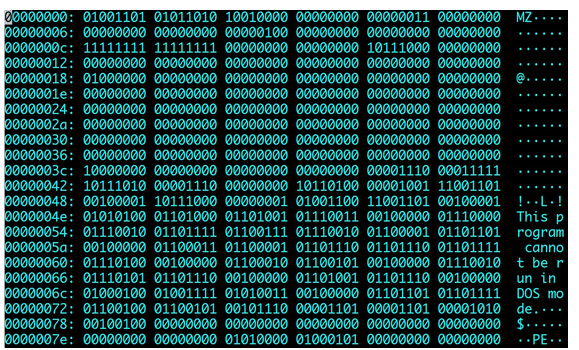
The values representing the color saturation typically range from 0 to 255, allowing them to be stored in a single byte in binary form.
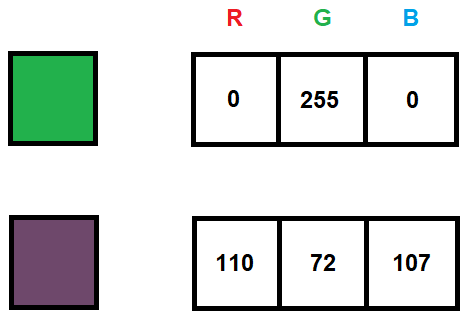
Fig. 2: Representation of colors of a single pixel on three channels in RGB format
Grayscale images are usually represented using a single channel, with values also ranging from 0 to 255. The number 0 represents black, while 255 represents white.
Sometimes there may be a need to represent a grayscale image on three channels. In that case, you can simply use the same value from the single-channel representation on all three channels.
Data Representation Method 2: Audio
In machine learning, audio files are usually processed in two ways: in raw audio form as a vector of amplitude values over time, or after transforming the signal representation into an image, known as a spectrogram.
Raw audio is a vector of amplitude values of sound intensity over successive time intervals. These intervals are defined by the sample rate, which indicates how many consecutive values in the vector represent measurements taken within one second. For example, if the sample rate is 48 kHz, it means that one second of recording corresponds to 48,000 consecutive measurements in the vector.
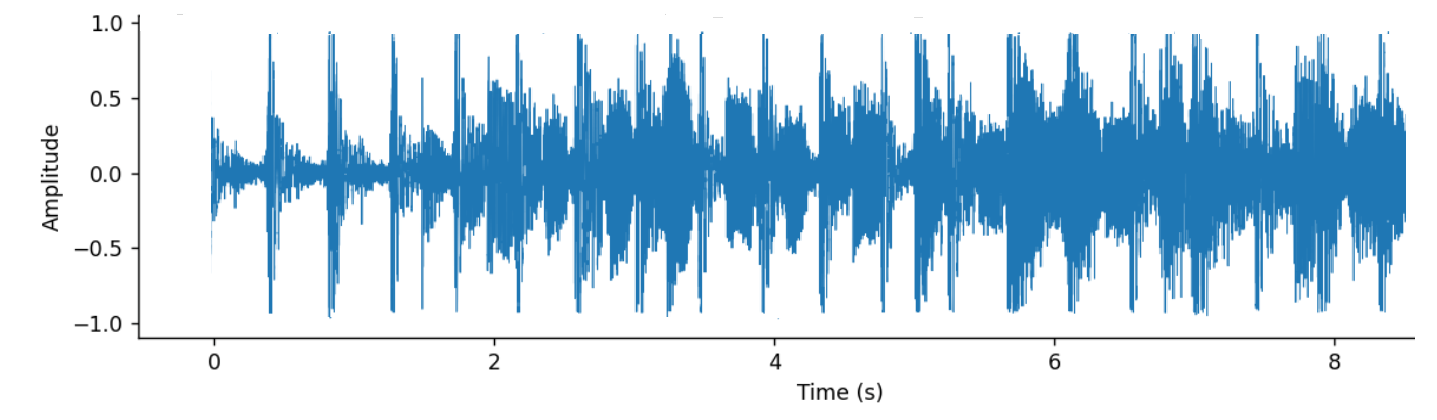
Fig. 3: A part of graphical representation of raw audio
Now, for the second of the aforementioned audio representations: spectrogram is an image that contains the sound spectrum over time. To obtain it, a discrete Fourier transformation (or a similar method) is applied to transform the audio signal into the frequency domain. Then, a power plot of the signal at different frequencies over time is created. As a result, you get a graph where the horizontal axis represents time, the vertical axis represents frequency, and the color in a given area of the graph represents the sound power.
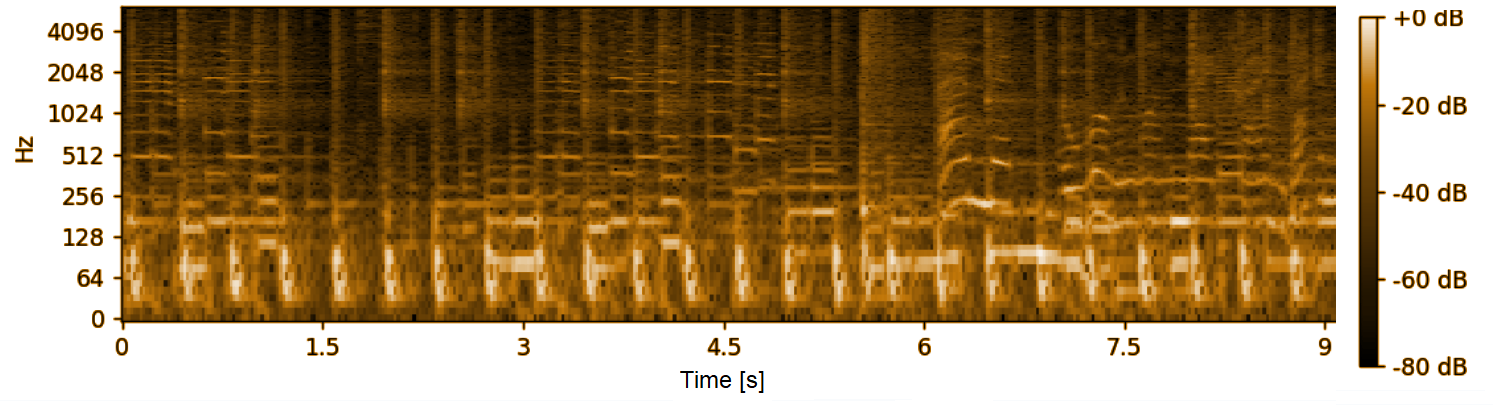
Fig. 4: Spectrogram of a 9-second audio file
Data Representation Method 3: Video
Video is essentially a sequence of images, sometimes with correlated sound. In machine learning algorithms, both modalities are processed separately, and the results obtained from both paths are combined in a specific way for a particular task. Sometimes one of the modalities is entirely ignored, focusing only on the analysis of sound or video, depending on the importance or availability of each modality, or hardware resources.
Regarding the analysis of the video itself, it is very similar to image processing, with the added consideration of how successive frames follow each other. This sequential nature carries a lot of information, both for the human eye and machine learning algorithms. If we were to shuffle the frames of a video, it would be much more difficult for us to understand its content. To preserve the sequence of images, video data is typically processed by grouping consecutive frames into sets of m frames. Just as with individual images, each m-frame set is treated as a single training sample. If you have video with a resolution of 1920 x 1080, saved in RGB format, and you group frames in sets of 10, a single sample containing information about these ten consecutive frames will be stored in an array with dimensions (1920, 1080, 3, 10).
As for the audio track, it is usually processed separately using the methods described above.
So… is this all?
Of course, although some of the most common data representation methods have been described above, this is by no means an exhaustive list - after all, there are many, many more types of data! Fortunately, for most basic machine learning tasks, the information provided above should provide a sufficient foundation to tackle them. Next week, we will begin a topic related to the Internet of Things (IoT), where machine learning comes into play, especially in the context of edge computing. If you're curious, we encourage you to follow our blog!